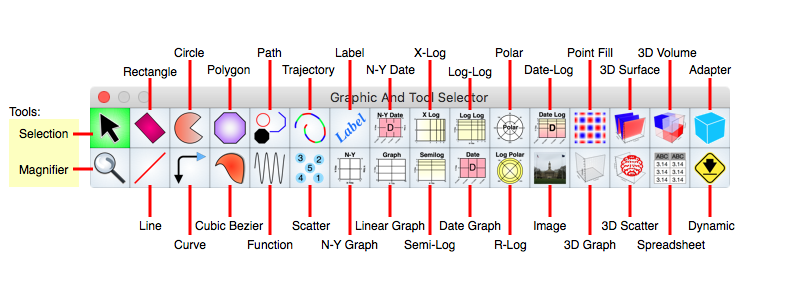
Graph IDE ► Overview ► Graphic Selector
The Graphic Selector determines which type of graphic you will make, or whether you want to select an existing graphic or not. The figure below show a typical Graphic Selector and annotates each cell of the Graphic Selector. This is just one form of Graphic Selector interface. The exact cell positioning and types can vary depending on what you have loaded into Graph IDE.
To select a mode of operation click on one of the cells in the Graphic Selector. Each cell is defined below.
Tool Cell Definitions
Click one of these cells to place the mouse operations in select or magnify mode.
| Selection | Click to set in selection mode. See Standard Editing for information on control behavior during Selection Mode. Unless you are going to create a graphic, this Selection mode should always be selected. |
| Magnifier | Click to set in magnification mode. While in this mode a mouse drag on a Graphic View or Graph defines the area to magnify to. This also brings forward the Magnifier inspector editor. |
Factory Cell Definitions
Click one of these cells to select the graphic type you will make next. After selecting move the cursor to a Graphic View and then mouse down and drag the mouse. Then release the mouse button. A graphic of the type selected will have been made. You can then proceed to alter its attributes. If you use a graphic with specific attribute values enough then you may want to put it on a Palettes for drag and drop creation. The graphic can also be instantiated from its Prototype inspector editor. That editor is loaded when a factory cell is selected.
After you make a graphic the Graphic Selector will reset to the selection tool. If you alt-click a factory cell to then create a graphic then the Graphic Selector will be in sticky mode and does not reset to the selection tool after graphic creation. While in sticky mode the selected cell is blue, otherwise the selected cell is green.
| Adapter | Specifies an adapter, which is a hook into the system views. |
| Circle | Specifies a circle, ellipse, or pie section. |
| Cubic Bezier | Specifies a cubic bezier graphic, which is a connected sequence of cubic bezier sections. After you create this graphic you will want to point-edit it to further create it. |
| Curve | Specifies a curved section, which is a line, elbow or curved elbow with caps. After you create this graphic you will want to add your own caps using the Caps sub-editor on the inspector. |
| Date N-Y Graph | Specifies a date x-axis and two linear y-axis, one on each side of the graph. |
| Date Graph | Specifies a date axis with one y-axis on the left side of the graph. |
| Date-Log Graph | Specifies a date axis with one log-y-axis on the left side of the graph. |
| Dynamic | Specifies a dynamic graphic which is actually a factory reference to load another type of, yet unknown, graphic. |
| Function | Specifies a function graphic. Use a function graphic to define a sequence of points running from the left to right. This is the prototypical curve on a graph used for plotting purposes. |
| Image | Specifies an image, which is any type of specification normally interpreted by the environment outside of Graph IDE. The image an be a PNG, TIFF or PDF representation for instance. |
| Label | Specifies a label, which is a single line of text encoded in UNICODE standard. |
| Line | Specifies a line segment. |
| N-Y Graph | Specifies a single x-axis and multiple y-axis graph. This is called a multiple coordinate rectangular graph and the coordinates can be of many mixed types. |
| Linear Graph | Specifies a graph. This is the graph one normally thinks about which is one linear x-axis and one linear y-axis. This is also called a rectilinear graph or Cartesian graph. |
| Log-Log | Specifies a graph with log axes in both directions. |
| Path | Specifies a path, which is a sequence of operations, some of which have operands. |
| Point Map | Specifies a point map graphic. Use a point map graphic to define a matrix of z-values where the z-values are represented by color. |
| Polar | Specifies a polar graph, also known as a radar graph. |
| Polygon | Specifies a polygon which is a sequence of points connected by line segments. When the line segments do not intersect midway then it is a polygon, otherwise it promotes to another form. |
| Rectangle | Specifies a rectangle, oval or parallelogram. |
| R-Log | Specifies a polar graph with a log scale in the r-direction. This is also known as a radar graph. |
| Scatter | Specifies a scatter graphic. |
| Semi-Log | Specifies a semi-log graph which is a graph with x-linear axis and y-log axis. |
| Spreadsheet | Specifies a spreadsheet graphic which is also a Table and can make a Pie Chart and Bar And Column Chart as well as other graphs. |
| Trajectory | Specifies a trajectory graphic. |
| X-Log | Specifies a X-oriented semi-log graph which is a graph with log x-axis and linear y-axis. Note that the word semi-log graph is usually reserved for a graph that has a log y-axis and linear x-axis. |
| 3D Graph | The graph on which 3D data graphics are made. This is also called a 3D perspective graph or a 3D rectilinear graph which is projected onto a view plane. |
| 3D Scatter | A 3D Scatter is a sequence of 3D points. |
| 3D Point Map | A 3D Point Map is a regular grid of z-values. The z-values are represented as the z-coordinate value thus producing the three dimensional effect. The z-values are mapped (several times) to a projected representation and that typically involves a radiance function. |
| 3D Volume | A Volume is a regular grid of densities (values ranging from 0 to 1). The densities are represented as cube sections on a regular grid where the cube has color specified by a color map. |