Graph IDE ► Inspector Editors ► Point Tags
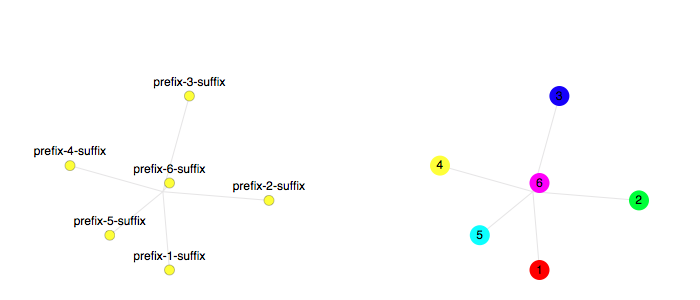
Most 2D Data Graphics and 3D Data Graphics have a point tags inspector editor that control that graphic's point-oriented graphical attributes called point tags. Point tags consist of markers and labels. Markers are an arbitrary graphic, such as a circle or square, placed at each data point. A marker can be made from scratch or selected from a pre-made palette of graphics as shown and described below. A Label is a single line of text centered about each point. The figures below show examples of point tags.
The inspector for point tags is described below.
Markers Editor
The Markers Editor is shown below.
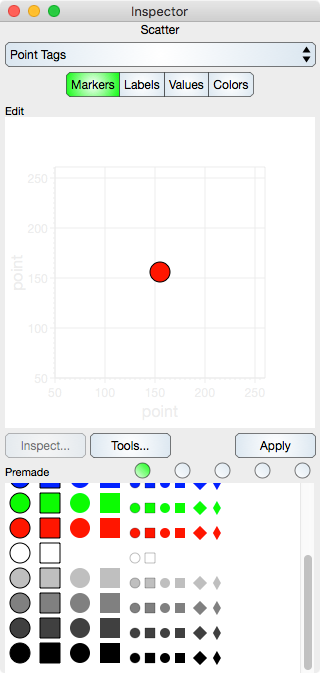
Edit
Edit : The Graphic View from which a marker can be edited. This is a general purpose graphic edit view so all of the tools of Graph IDE are at your disposal while making a marker.
Inspect : Forwards an inspector editor that is applicable to the Edit view. To see controls in the resulting inspector editor for the marker first make sure that you have selected the marker in the Edit view.
Tools : Forwards a Graphic Selector that is applicable to the Edit view.
Apply : Applies (copies) the graphic in the Edit view as the marker for the focused graphic.
Premade
A group of various premade graphics. Click on a graphic to make it the current marker, or click not-on-a-graphic to remove the marker.
Template Selection : Select one of the radio buttons to see up to five different premade templates.
Labels Editor
Labels are a single-line textual graphic, either arbitrary or predefined, placed at each data point. A label is formulated as described below.
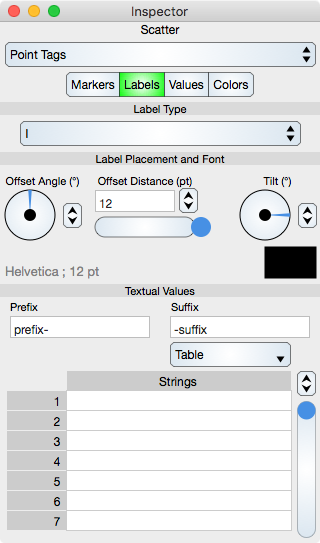
Label Type
Label Type : The label is constructed as one of: {"None", "I", "X", "Y", "X, Y", "Fixes", "Values", "Custom Strings"}; where "None" means no label, "I" is the index of the point, X is the x-value, Y is the y-value, "X, Y" is the x-value and y-value pair with a comma in between, "Fixes" is the prefix and suffix text only, "Values" is the value as defined in Values (see below) and "Custom Strings" is the arbitrary text entered into the table. Each type (except None and Custom Strings) always shows the fixes (if any).
Label Placement and Other Parameters
Offset Angle : The offset angle of the label relative to each point.
Offset Distance : The offset distance of the label from each point.
Rotation Angle : The angle of the label relative to each label center point.
Font Name ; Size : Shows the label font name and size. Selecting this label brings up the Font Selector. This label is grey text and does not look like a control.
Color : The text Color of the label.
Textual Values
Prefix : The text that is prepended to the start of the label.
Suffix : The text that is appended to the end of the label.
Strings : Table controls are described in the Tables section. The rows represent custom label strings. The table cells are string (textual) elements. Note that if the Data sequence is resorted then the Custom Strings sequence will not be resorted.
Values Editor
Values are numbers that are applied to each point as either a label or a scaling of the marker (for bubble graphs). When scaling, the marker linear mapping factors are applicable. That mapping is defined as follows:
factori = scale * (valuei - min)/(max - min) + offset
Factor multiplies the marker's size (width and height). When min and max are the values minimum and maximum values and offset is zero then the factor is between zero and scale, meaning that markers are scaled by the value times scale. For example: If scale is 10 then the markers are made 10 times bigger after multiplying by value. When offset is one then the marker is no smaller than the marker as defined without values applied (with no values entered into the table).
When using the Set Of 2D Points task in the Chart tasks, min and max are the minimum and maximum of all data points, offset is one and scale is a value that is zero or greater.
Values controls are shown and defined below.
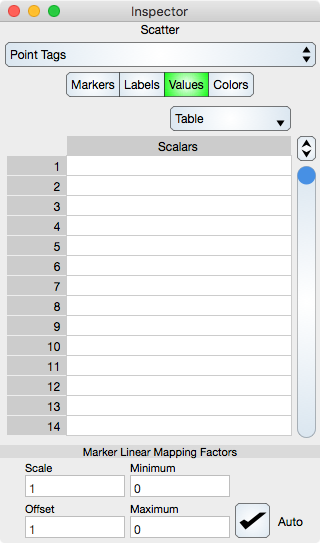
Table
Scalars : A Table that shows and edits scalar values. The table cells are scalar (number) elements. Scalars in the table are the values that are applied to each point as either a label or a scaling of the marker. Note that if the Data sequence is resorted then the Values sequence will not be resorted.
Marker Linear Mapping Factors
Scale : Scale factor
Offset : Offset factor
Minimum : The minimum value.
Maximum : The maximum value.
Auto : When on, the minimum and maximum are computed from the table entries.
Colors Editor
Individual markers can have a separate fill color which can be assigned by the colors table shown below.
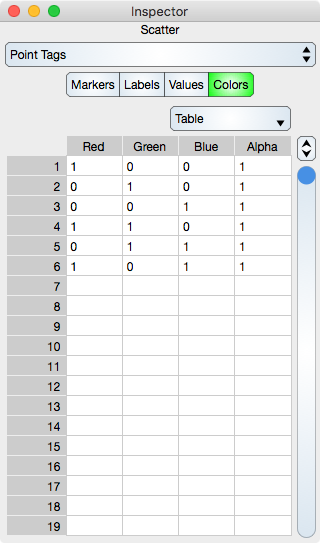
Table
Table controls are described in the Tables section.
The rows represent a marker color values. While in Atomic mode, the cell represents a rgba value and while in component mode the cell represents either single r, g, b and a. Hence, in atomic mode there is one column while in component mode there are four columns. When entering data into each cell make sure to provide four numbers from zero to one which correspond to the red green blue alpha channels of the color. Zero means less color component while one means most color component. Zero alpha means transparent while one alpha means opaque.
Note that if the Data sequence is resorted then the Color sequence will not be resorted.