Graph IDE ► Graphs
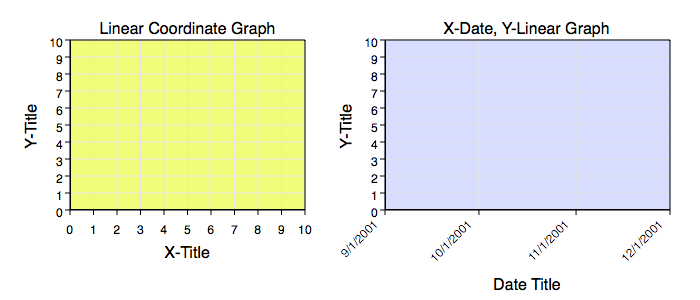
A graph is normally defined as combination of Data Graphics with a graphic that displays attributes of the coordinate system that the data is embedded in. The figure below shows examples of graphs without any data on them. Realize that most people think of a graph as both the graphic that represents the coordinate system and also the data graphics on the graph (such as a line graph). In Graph IDE, the graph definition excludes the data graphics.
You make a graph just like any other graphic, as explained in Standard Editing (by dragging it out or dragging it from Palettes or the Factory Inspector) or by using Chart Tasks. A subsequent section (Getting Data On A Graph) explains how to get data onto the graph.
Notice that each graph inspector editor has a Unit Selector for each dimension of the graph. When you create data on a graph is inherits the units of the graph dimensions so that there are no unit selectors for data graphics. Units show in the Cursor Information and other locations to aid in determining the currently focused coordinate system.
In the current implementation, units do not define a coordinate map and they merely label the coordinate dimensions. Coordinate mapping is a separate control explicitly set in each graph inspector editor. Setting units for a graph is straight forward, however setting coordinate maps can be challenging. Chances are, you will not need to set coordinate maps (except for a preset mapping of angle (from radians to degrees) on polar graphs, or perhaps non-decimal bases on a log graph). Typically, the data itself is remapped onto a default coordinate system. There are many ways to remap data, for example the Formula Selector. Notice that remapping data permanently alters the data while mapping coordinates maintains the data values and merely alters the mapping onto the graph coordinate (and by nesting the page coordinate).
The following is a brief list and definitions of graph related sections:
| Section | Graphs |
| Autoscaler | The autoscaler adjust graph limits in predefined ways, normally associated with the base of the axis limits. |
| Date Axis | A single dimension of a coordinate of a graph is represented by an axis. The date axis represents a date dimension of a coordinate system. Note that date might imply a specific unit, but that is actually not the case. See the section on Date Axis for additional information. |
| Getting Data On A Graph | Explains how to get a Data Graphic on the graph. |
| Graphic Attributes | Almost all graphs have some common graphic-related attributes. This section describes them. |
| Label Mapping | Axis values are shown by their labels. Labels can be mapped into different representations in order to make the relationship between data and graph more understandable. It is the label mapping which defines this attribute. |
| Linear Axis | A single dimension of a coordinate of a graph is represented by an axis. The linear axis represents a linear dimension of a coordinate system. |
| Log Axis | A single dimension of a coordinate of a graph is represented by an axis. The log axis represents a log dimension of a coordinate system. |
| Multiple Coordinate Graph | A graph which defines several colocated coordinates. For each point on the graph the coordinate representing that point is defined by a related parameter, the focused coordinate index. |
| Non-Linear Graphs | Describes aspects of working with non-linear graphs. |
| Polar Axes | The polar axes represents a theta and r-oriented axis. |
| Single Coordinate Graph | A graph which defines only one coordinate. The coordinate can be of any type, linear, log, polar, nonuniform; however, there needs to be only one coordinate per point on the graph. |
The following is a list of combinations of axis that can be made via the Graphic Selector in order to form 2 dimensional graphs.
| Section | Axis Combinations That Form Standard Graphs |
| X-Y Graph | This is the usual graph everyone knows about. It has an x-axis at the bottom and a y-axis on the left and both are linear axes. |
| X-Date, Y-Linear Graph | This graph has the usual y-axis on the left, but the x-axis is a date axis, which can have non-uniform tick placement if the date unit increments non-uniformly, such as for months (For example, February has 28 days and January has 31 days). |
| N-Y Graph | This is the graph you would use if your data had a common x-axis unit, such as distance in meters, but the y-axis units are different, for example one data curve of pressure and the other of temperature. |
| X-Date, N Y-Linear Graph | Use this type of graph if the data has x-values in units of seconds since 1970 and there are two or more data sets of different y-units. |
| X-Linear, Y-Log | The standard semi-log graph. |
| X-Log, Y-Linear | A semi-log graph where the log coordinate is the x-direction not the y-direction. |
| X-Log, Y-Log | Also known as the log-log plot. |
| X-Date, Y-Log | A date-graph where the amplitude (y-direction) is expressed in log units. |
| Polar | Also called a radar graph. This graph shows the x-axis in terms of angle about a point and the y-axis radially. The angle dimension is the independent variable dimension. |
| Log-R | Also called a log-polar graph. This graph shows the x-axis in terms of angle about a point and the y-axis radially as a log axis. The angle dimension is the independent variable dimension. |
The Vvidget system generalizes combinations of axis to form graphs, so the combinations of axis to form graph can become very large. Graph IDE constrains the combinations to the usual types (and in some instance perhaps some very unusual ones).