Table Of Contents
Once a Dynamic Graphic is loaded then it is replaced by an actual graphic that can be instantiated. That graphic is not part of the Graph IDE system and this section simply gives an example.
The example shows how a Scatter Graphic can be overloaded to present connection parameters for direct access to a database. For this to work, the connection library, such as an ODBC library, must be (statically) linked into the graphic bundle.
As you can see, the resulting graphic inspector editor shows little resemblance to the overloaded component within Graph IDE and that is the point. A graphic bundle can radically alter the Graph IDE functionality and focus only on the particular domain specific input parameters and business logic while still maintaining the generality of a comprehensive data visualization system.
Inspector Editor
The Inspector Editor for the database example is shown below.
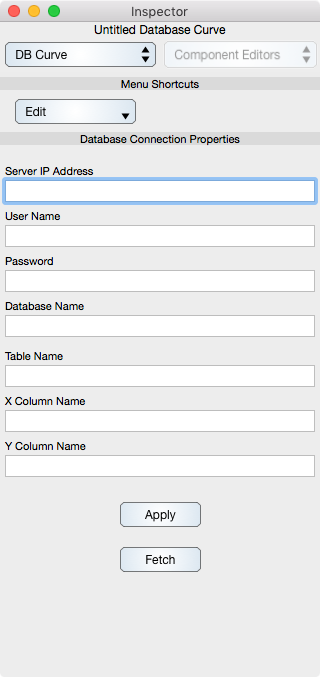
Database Connection Properties
Server IP Address : The IP number of the server computer that hosts the database server.
User Name : The user name of an account within the database server.
Password : The password of an account within the database server.
Database Name : The database name within the database server.
Table Name : The table within the database.
X Column Name : The column name within the table that represents the independent variable.
Y Column Name : The column name within the table that represents the dependent variable.
Apply : Applies the Database Connection Properties.
Fetch : Fetches data from the database server and updates the associated graphical representation.